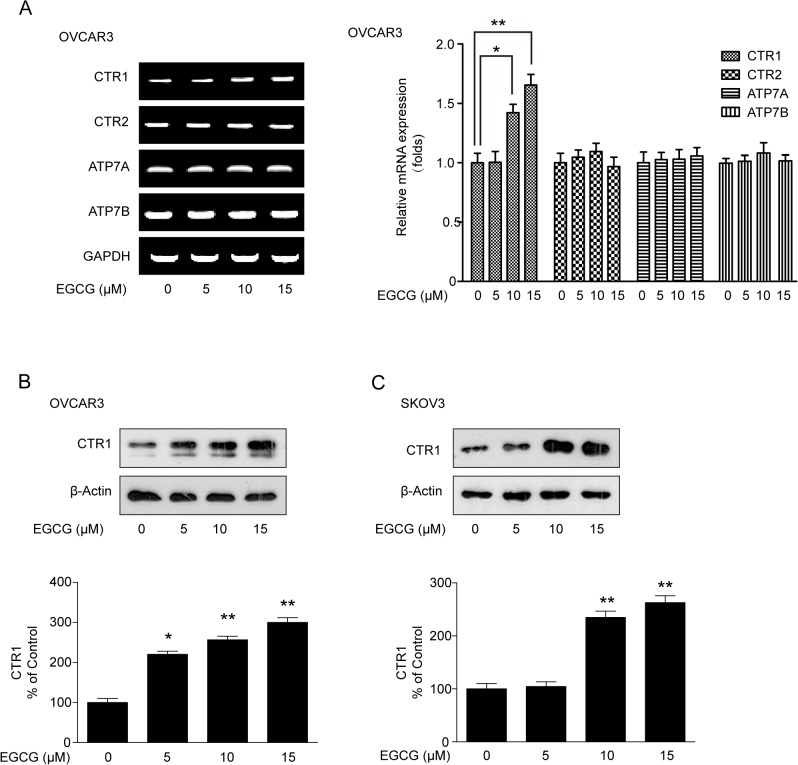
Fig 3. Effect of EGCG on the expression of copper transporters.
(A) Effect of EGCG on mRNA expression of CTR1, CTR2, ATP7A and ATP7B. After OVCAR3 cells were treated with indicated concentrations of EGCG for 24h, RT-PCR and qPCR were carried out to measure the CTR1 mRNA expression. (B and C) Effect of EGCG on CTR1 protein expression in OVCAR3 and SKOV3 cells. The cells were treated with 10 μM EGCG for 24 h, then followed by western blot analysis. The bands were quantified with Image J software. (*P<0.05, **P<0.01)

