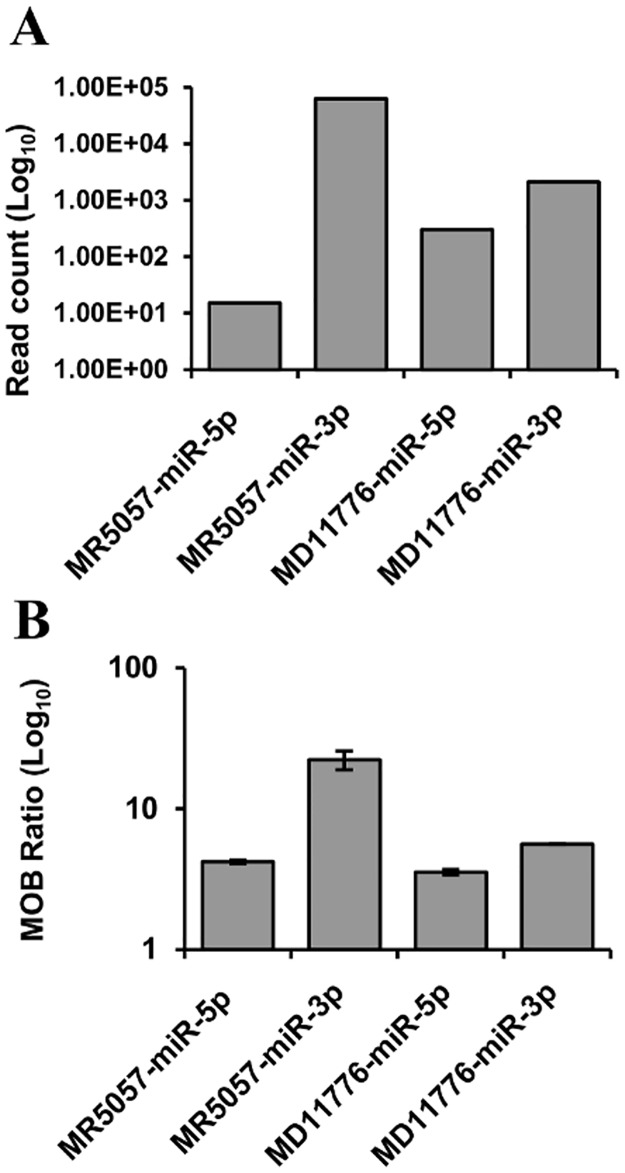
Fig 3. Comparison of the levels of miRNAs derived from CyHV-3 pre-miRNA candidates MR5057 and MD11776.
(A) Small RNA deep sequencing read counts and (B) DNA microarray miRNA probe hybridization signal intensities corrected and expressed as multiples of background (MOB). Data from both (A) and (B) were obtained using size-selected miRNA-inclusive RNA (F1 fraction; 17–25 nt) from the same in vitro infection (CyHV-3 H361 isolate). No corresponding hybridization signals were detected in miRNA non-inclusive RNA (F2 faction; 26–35 nt) from the same infection or in miRNA inclusive RNA (F3 fraction, 17–25 nt) from non-infected cells (Dataset S in S1 File). Error bars represent the data range.

