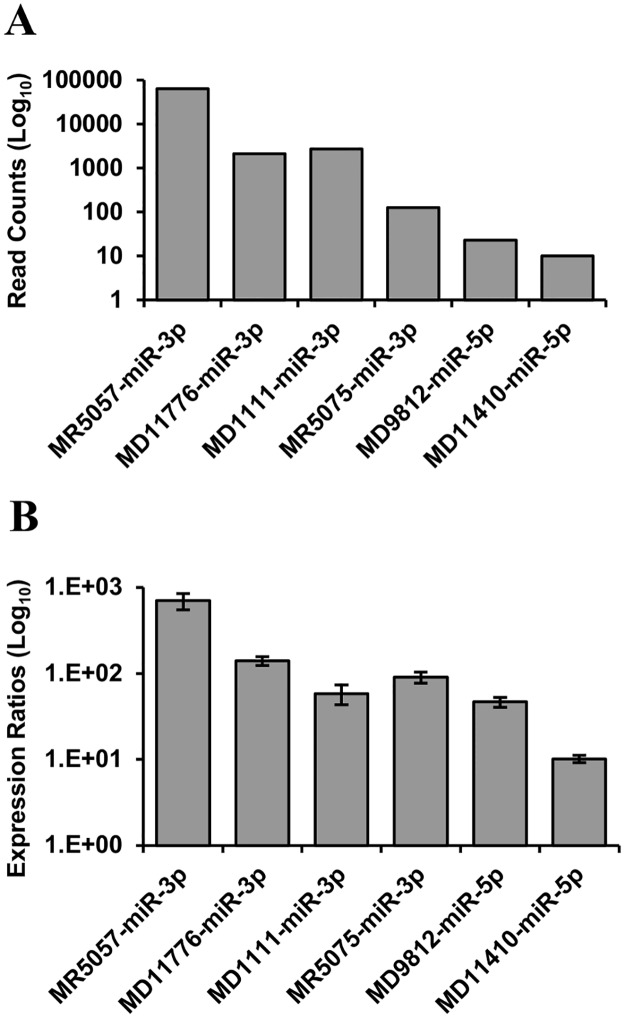
Fig 5. Relative expression levels of the dominant miRNAs from six high probability CyHV-3 pre-miRNAs.
RNA prepared from CyHV-3-infected CCB cells was analysed for viral miRNA expression by (A) small RNA deep sequencing (read counts), and (B) stem-loop RT-qPCR. In (B), all input cDNA came from a common RT reaction; values shown are based on means of replicates and error bars represent the data range.

