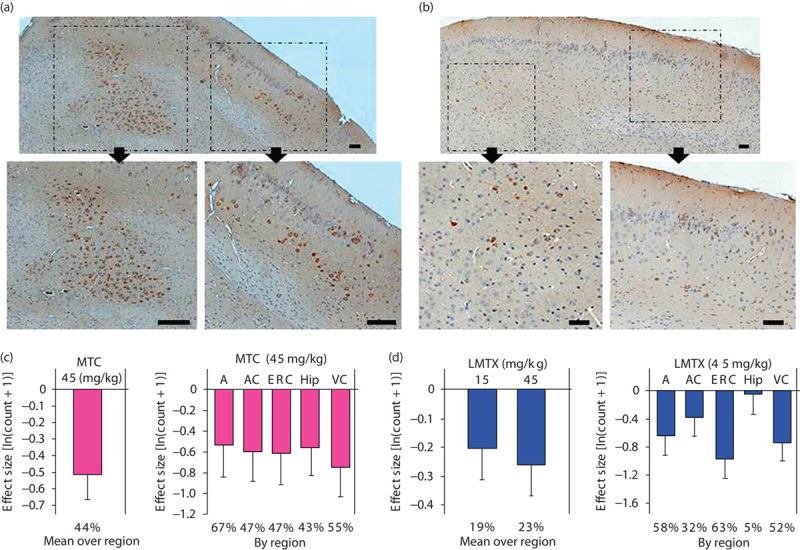
Fig. 9.

Immunohistochemical analysis of the effects of MT on tau aggregates in L66 mouse brain. Representative photomicrographs of L66 brain sections treated with (a) vehicle or (b) LMTX (45 mg/kg). The top sections depict intracellular tau stained with mAb 7/51 in the entorhinal cortex, with inserts showing regions of interest depicted with higher magnification below (arrows). There was less tau in the LMTX-treated tissue. Scale bar, 100 μm. The effect size, expressed as ln(count+1)+S.E., is shown for means over all regions and by individual region for (c) MTC and (d) LMTX. *P<0.05, **P<0.01, ***P<0.001. The percentage reduction in counts compared with zero dose is shown at foot. The 45 mg/kg doses are equivalent to 35.1 mg MT/kg and 28.1 mg MT/kg for MTC and, in this case, LMTB, respectively. A, amygdala; AC, auditory cortex; ERC, entorhinal cortex; Hip, hippocampus; L66, Line 66; LMTX, leucomethylthioninium salt; mAb, monoclonal antibody; MT, methylthioninium; MTC, methylthioninium chloride; VC, visual cortex; WT, wild type.
