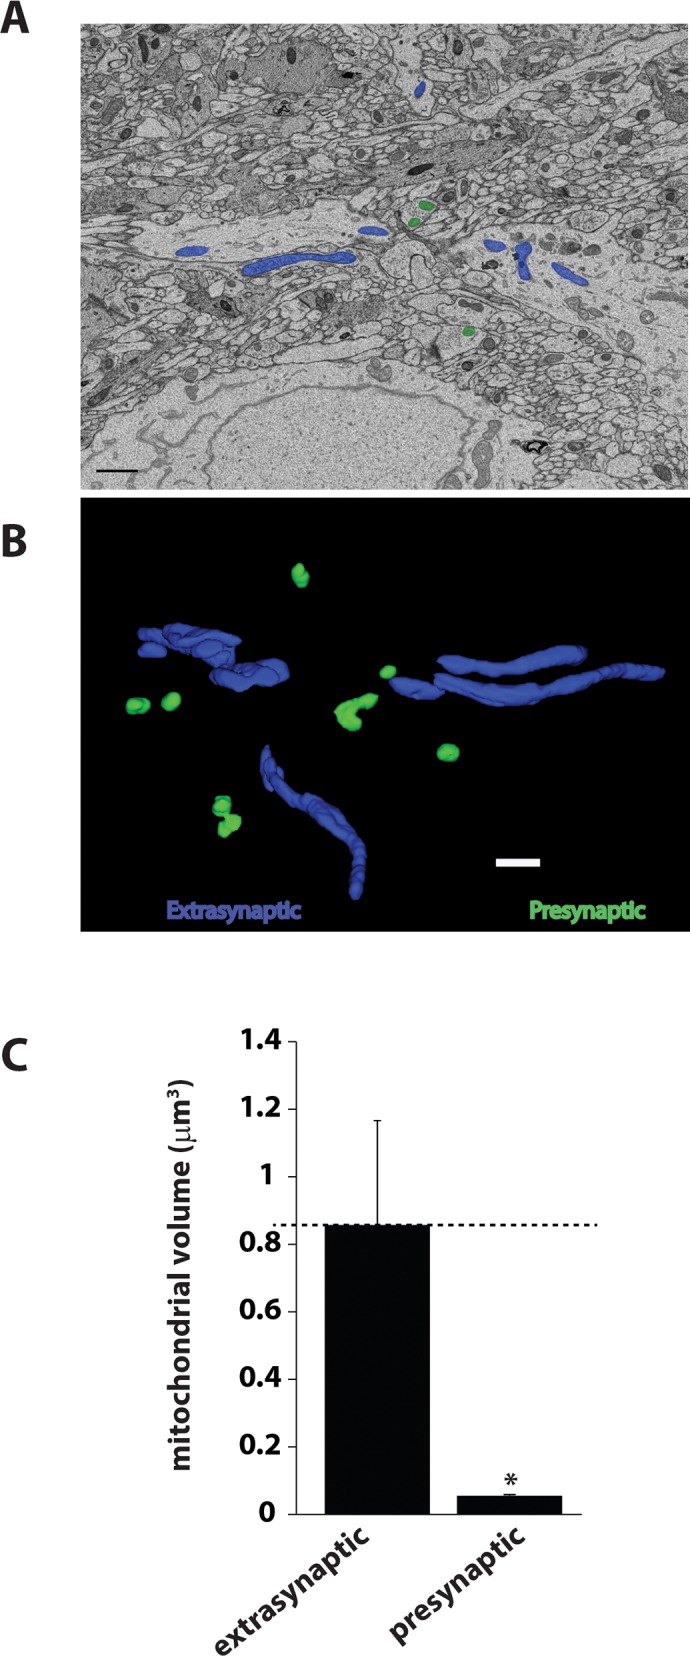
Fig 4. Presynaptic mitochondria are relatively small in volume compared to somatic mitochondria.

A) Representative 2D image from the SBFSEM dataset showing extrasynaptic mitochondria in blue and presynaptic mitochondria in green. B) 3D reconstructions of presynaptic and extrasynaptic mitochondria using TRAKEM2 software. Scale bar = 1000 nm. C) Bar graph depicting the volume of extrasynaptic and presynaptic mitochondria. Data are plotted as mean ± SEM. n = 3 different sets.
