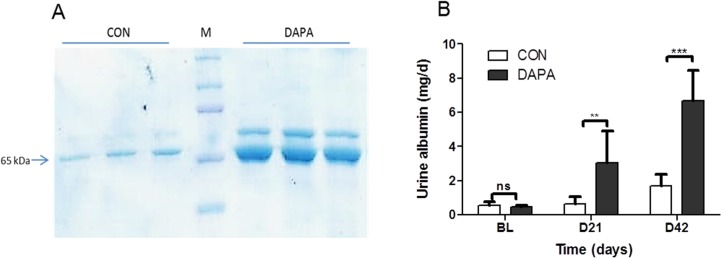
Fig 2. Effect of DAPA on albumin excretion.

Urine protein analysis by SDS-PAGE from urine samples of PCK rats after 6 weeks of treatment with vehicle (CON) or dapagliflozin (DAPA). Each lane shows urine sample of a single PCK rat. Sample volumes were corrected for diuresis and amounted to 15 μl for CON and 45 μl for DAPA. Arrow shows the band for albumin. M = molecular weight marker (A). Urine albumin concentration as measured by ELISA, in mg/day (B). N = 8 per group. Columns represent means ± SE. **P<0.01, ***P<0.001 when comparing CON and DAPA at each time point, ns = non-significant.
