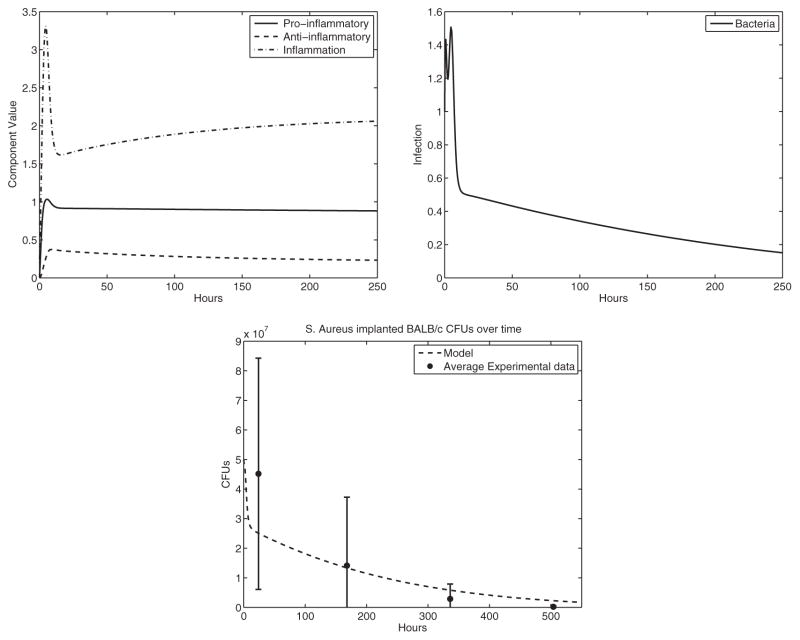
Fig. 3.
Experiment 1: BALB/c response results in the clearance of infection. We consider this our basis experiment to compare other experimental responses. The stable equilibrium (basal level) is (P̄, Ā, Ī, B̄) ≈ (0.82, 0.20, 2.10, 0) with eigenvalues λ ≈ −0.06, −0.17, −0.44, −0.95. Top left: immune system components, top right: bacterial component, bottom: we present this dimensional simulation of the model output to compare with the experimental data for this particular experiment. We scaled the model output based on the observed Colony Forming Units (CFUs) of bacteria.

