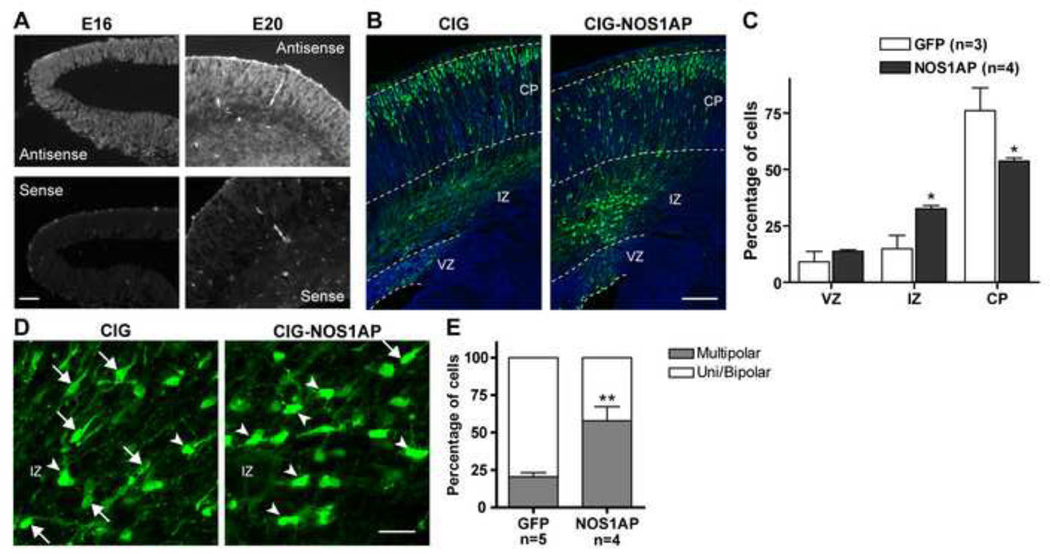
Figure 1. Effect of overexpression of NOS1AP on cortical neuron migration.
A, In situ hybridization data showing that NOS1AP is expressed in the cortex during development (representative images shown at E16 and E20). B–E, CIG or CIG-NOS1AP plasmid was electroporated into the lateral ventricular wall at E16 and analyzed at E20. B, Representative images of coronal sections of rat somatosensory cortex are shown for each condition. Sections were immunostained for GFP (green) and counterstained with Hoechst (blue). C, Quantification of the percentage of transfected cells in each cortical area. D, Representative images of transfected cells in the IZ for each condition (arrows show examples of mono/bipolar cells and arrowheads examples of multipolar cells). E, Quantification of the percentage of transfected cells within the IZ with mono/bipolar or multipolar morphology. VZ = ventricular zone, IZ = intermediate zone, CP = cortical plate. Results are means ± SEM. *p<0.05 and **p<0.01 versus control. Scale bars: 50 µm (A), 150 µm (B), 25 µm (D).

