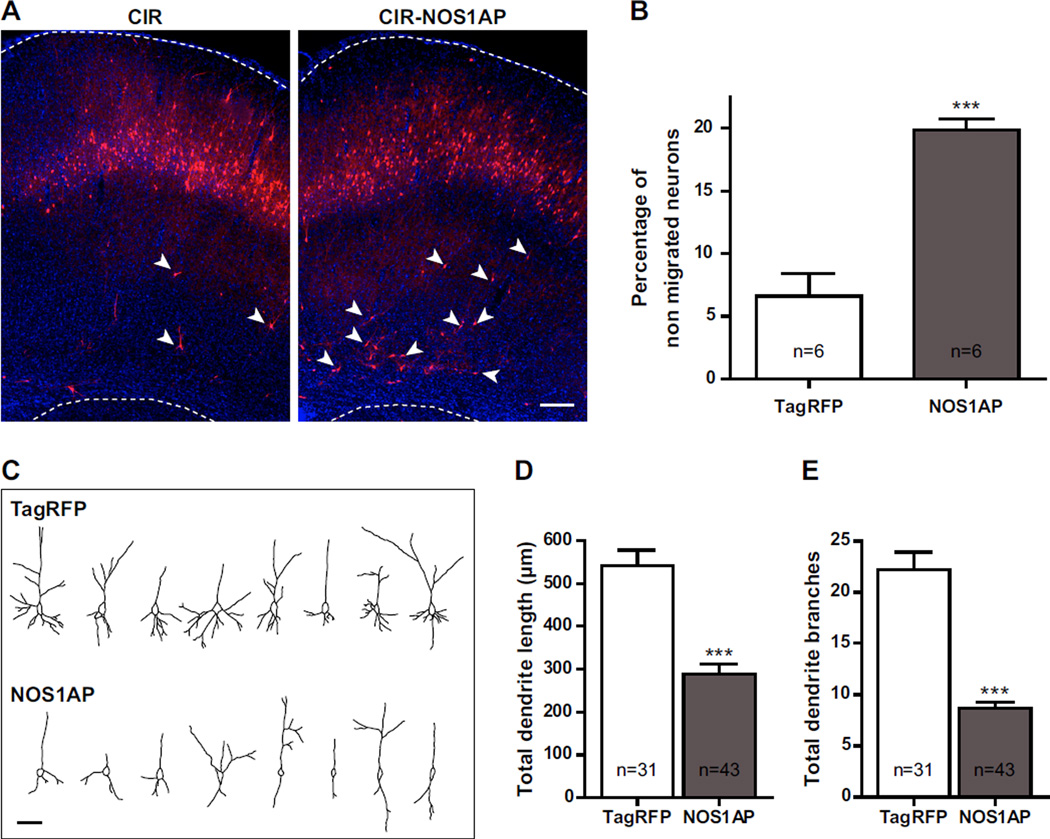
Figure 3. Overexpression of NOS1AP affects cortical neuron migration and morphology.
CIR or CIR-NOS1AP plasmid was electroporated into the lateral ventricular wall at E16 and brains were analyzed at P14. A, Representative images of coronal sections of rat somatosensory cortex are shown for each condition. Sections were counterstained with Hoechst dye (blue). B, Quantitation of the percentage of transfected cells that did not complete their migration at P14 (arrowheads in A show examples of non-migrated cells in each condition). C, Representative NeuronJ tracing of transfected cells in layers II/III for each condition. D–E, Quantification of the total dendritic length (D) and of the total number of dendrite branches (E) of transfected cells in layers II/III. n values in D and E refer to the number of analyzed cells, from 5 different brains per condition. Results are means ± SEM. ***p<0.001 versus control. Scale bars: 250 µm (A), 50 µm (C).

