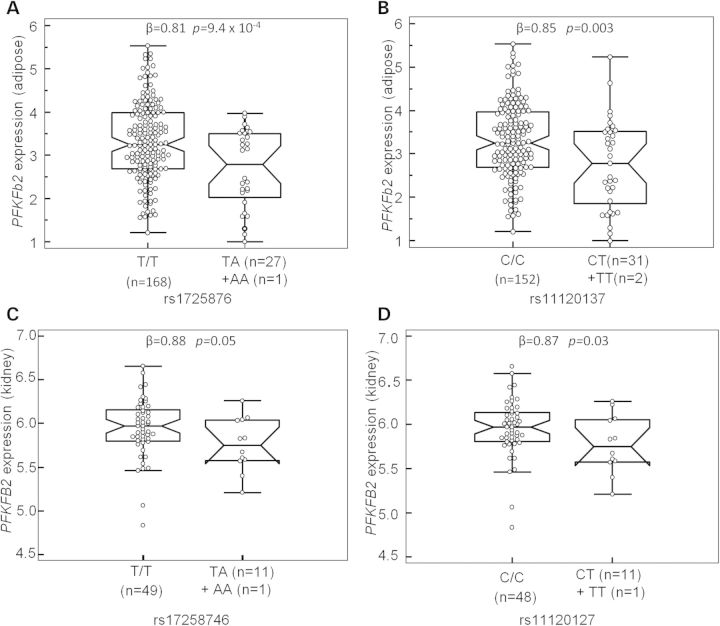
Figure 4.
Correlations of genotypes of PFKFB2 SNP rs17258746 or rs11120137 with relative quantity of PFKFB2 RNA from adipose tissue biopsies of 201 non-diabetic Pima Indians (A and B) and kidney glomerular tissue biopsies of 61 diabetic AI (C and D). Box plot shows raw data in median, 25th and 75th percentiles, maximal and minimal values. Individuals homozygous for the minor risk allele are combined with those of the heterozygotes for statistical analyses. The relative PFKFB2 expression levels in adipose tissues are log10-transformed to approximate the normal distribution. The p value is adjusted for age, sex, % body fat and Pima heritage. The PFKFB2 expression levels in kidney tissues were batch corrected using Combat (26) from Genepattern and log2-transformed. The P value is adjusted for sex, diabetes duration and heritage.

