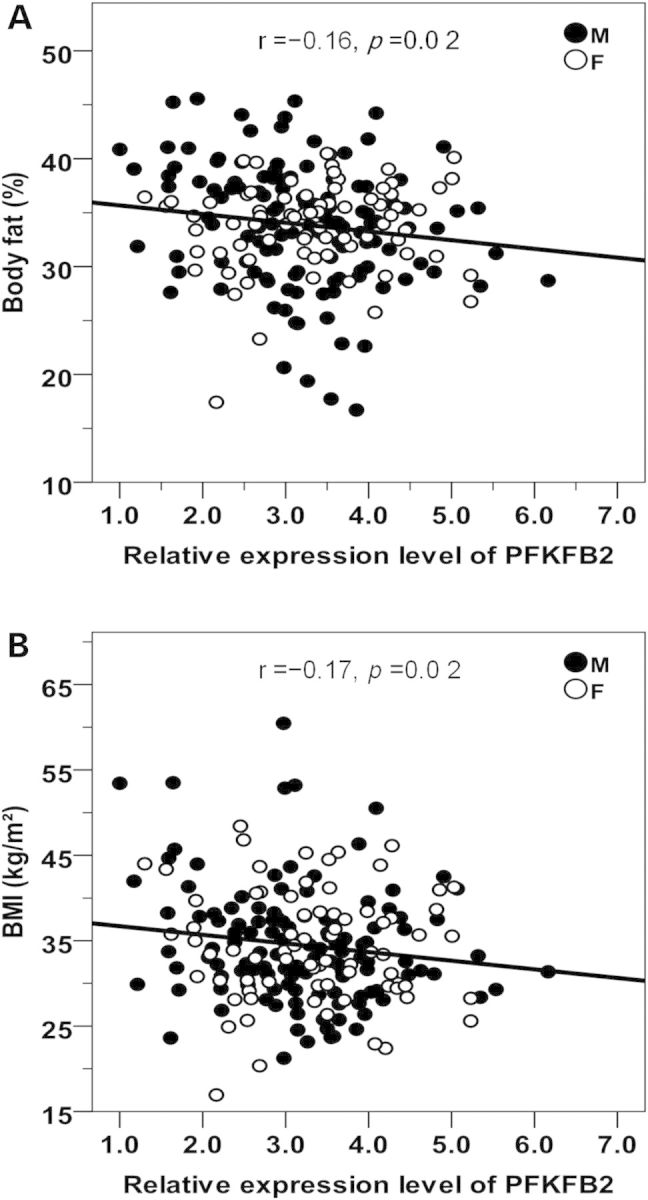
Figure 5.

Inverse correlations between PFKFB2 expression levels in adipose tissues and % body fat (A) and BMI (B) in 201 non-diabetic Pima Indians. The relative PFKFB2 expression levels are log10-transformed to approximate the normal distribution. The P value is adjusted for age, sex and Pima heritage. M: male; F: female.
