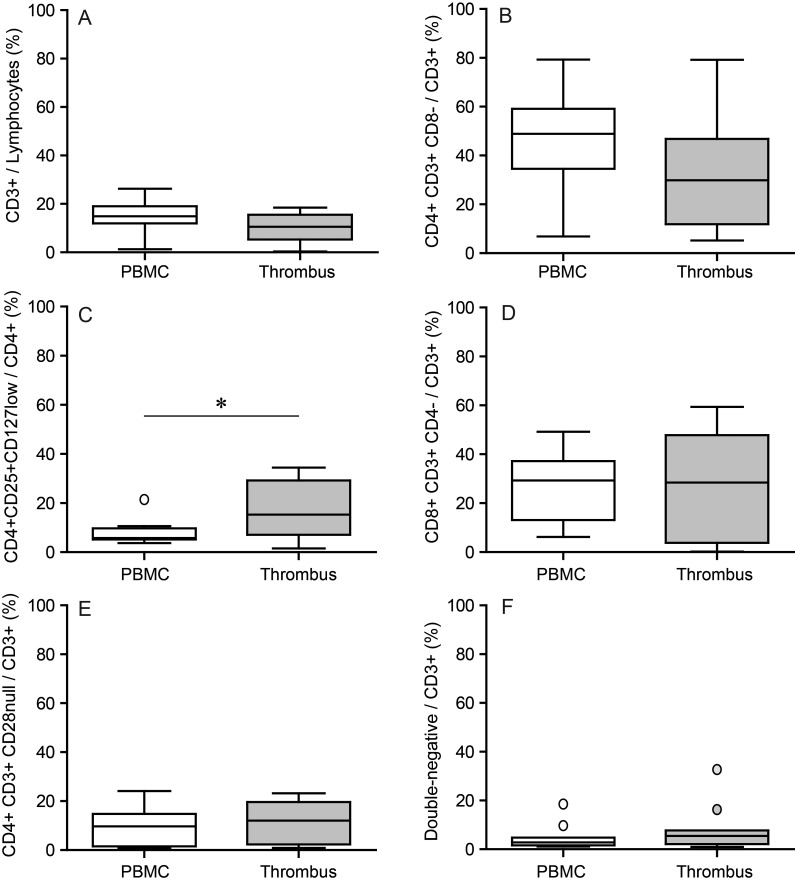
Figure 1.
Treg as prominent T cell subset in coronary thrombi vs. peripheral blood from patients with ACS. Flow cytometry of coronary thrombus and PBMC from patients with ACS. Double-staining for T cell subtypes (CD3 with CD8 or CD4, respectively). (A) T cells (CD3+). (B) T helper cells (CD4+ CD3+ CD8−). (C) Regulatory T cells (CD4+ CD25+ CD127low). (D) Cytotoxic T cells (CD8+ CD3+ CD4−). (E) CD4+ CD3+ CD28null T cells. (F) Double-negative T cells (CD4null CD8null CD3+). The bottom and top of the box represent the first and third quartiles (Q1, Q3), and the band inside the box is the median. The whiskers extend to the most extreme data point which is no more than 1.5 times the interquartile range (IQR = Q3−Q1) from the box, with individual outliers shown beyond the whisker; n = 9–12; *P = 0.0098.

