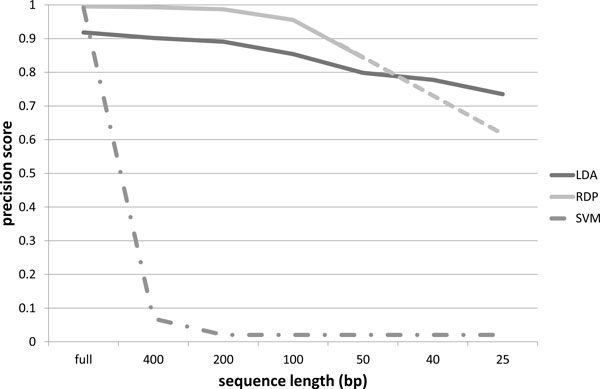
Figure 6.

Precision scores at order level. Precision scores, defined as true positives/(true positives + false positives), trends as a function of the sequence size (full length, 400 bp, 200 bp, 150 bp, 50 bp, 40 bp, 25 bp), for the Latent Dirichlet Allocation (LDA), Ribosomal Database Project (RDP) and Support Vector Machine (SVM) classifiers at order taxonomic rank. The dashed line for the RDP curve represents extrapolated values.
