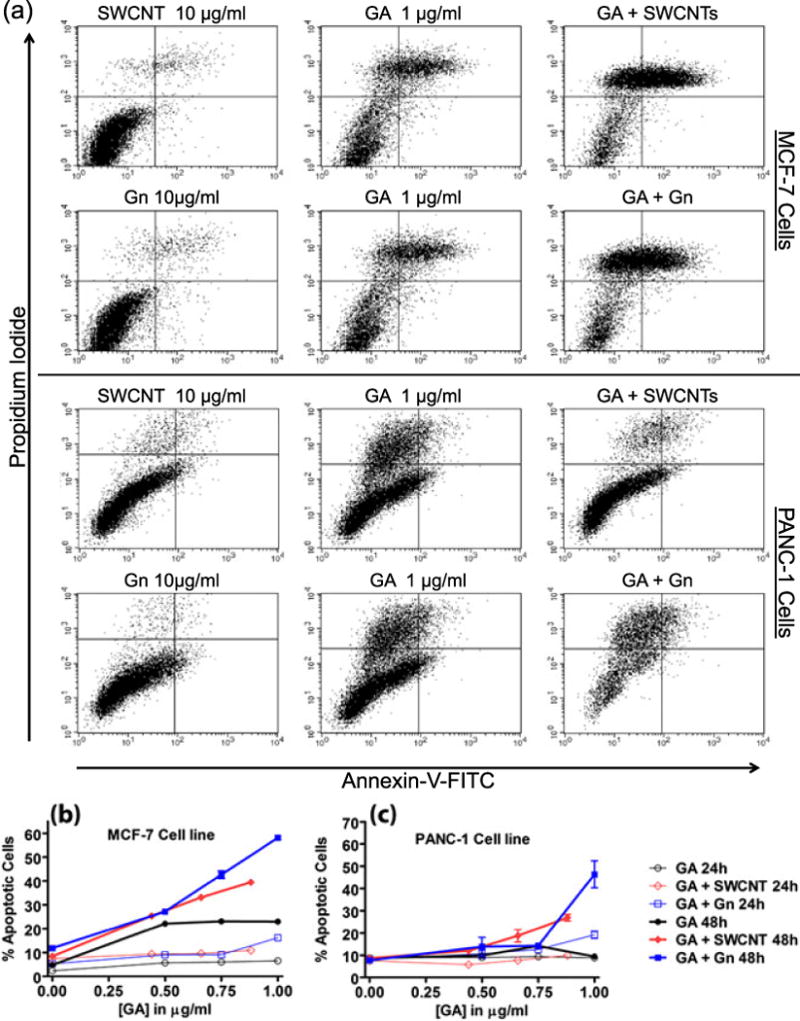
Figure 7.

Flow cytometry analysis of MCF-7 and Panc-1 cells treated with GA, GA + Gn and GA + SWCNT and stained with annexin-V/propidium iodide. (a) Representative histograms of flow cytometric analysis of the two cell lines after treatment with GA (1 μg ml−1), Gn (10 μg ml−1), SWCNT (10 μg ml−1), GA + Gn (1 + 10 μg ml−1), and GA + SWCNT (0.9 + 10 μg ml−1) for 24 h. (b) The percentage of apoptotic MCF-7 and (c) Panc-1 cells after exposure to increasing concentrations of GA (0–1 μg ml−1) at a constant Gn or SWCNT concentration (10 μg ml−1) for 24 and 48 h. FITC, fluorescein isothiocyanate; GA, gambogic acid; Gn, graphene; SWCNT, single-walled carbon nanotube.
