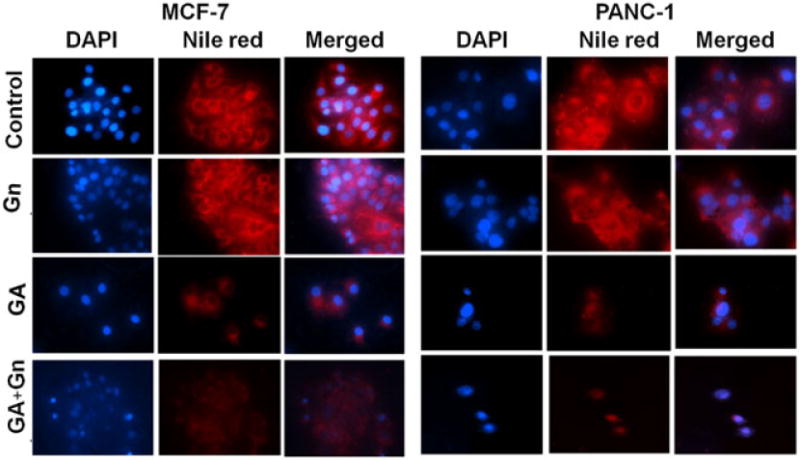
Figure 8.

Representative fluorescence microscopy images of MCF-7 and Panc-1 cells treated with GA, GA + Gn and stained with DAPI and Nile Red. MCF-7 and Panc-1 cells were incubated with GA (1 μg ml−1), Gn (10 μg ml−1), and GA + Gn (1 + 10 μg ml−1) for 48 h. DAPI-stained nuclei appear blue, and Nile Red-stained lipids appear red. Data were obtained from three independent experiments (n = 3). GA, gambogic acid; Gn, graphene.
