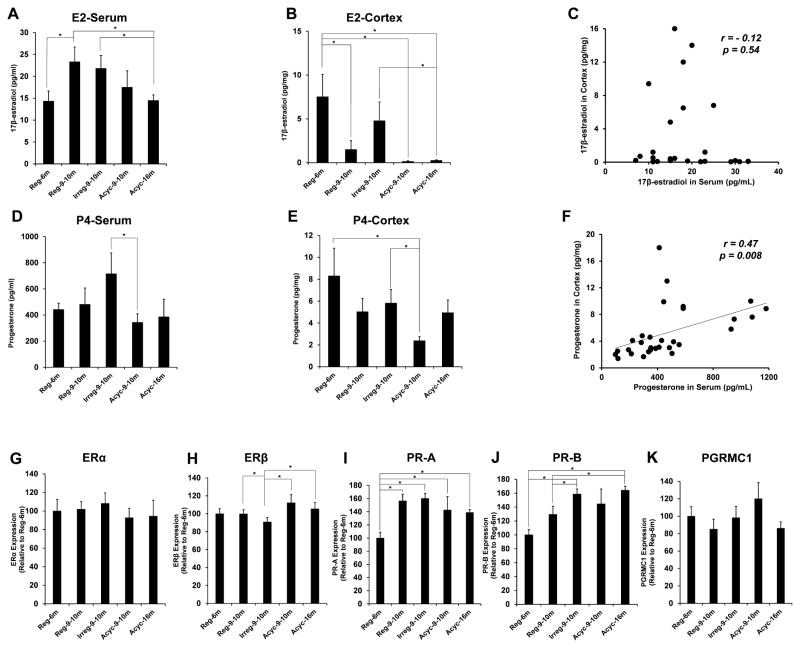
Figure 2. Steroids levels and the expression of steroid receptors in PAM.
A. Serum levels of 17β-estradiol (E2). B. Cortical levels of E2. C. Correlation of serum- and cortical levels of E2 with r-value and p-value shown. D. Serum levels of progesterone (P4). E. Cortical levels of P4. F. Correlation of serum- and cortical levels of P4 with r-value and p-value shown. G–K. Expression of estrogen- and progesterone receptors in the hippocampus: G. ERα; H. ERβ; I. PR-A; J. PR-B; K. PGRMC1. All samples were collected on estrus day. Data were presented as average ± SEM, *p ≤ 0.05, n = 6.

