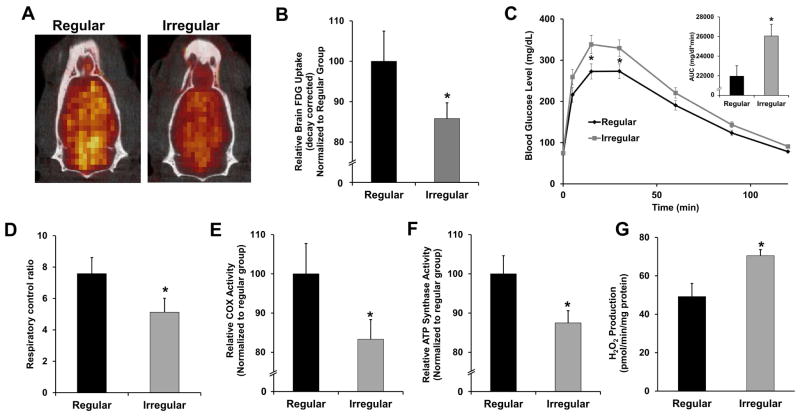
Figure 5. Brain metabolic function during regular-irregular transition.
A. Representative FDG-microPET/CT scan images in regular and irregular cycling rats. B. Relative glucose uptake in regular and irregular groups measured by FDG-microPET/CT. C. Glucose tolerance test of regular and irregular cycling rats and the quantification of the area under the curve (AUC). D. Respiratory control ratio of mitochondria isolated from whole brain. E. Complex IV activity of mitochondria isolated from whole brain. F. ATP synthase activity of mitochondria isolated from whole brain. G. Rate of H2O2 production of mitochondria isolated from whole brain. Data were presented as average ± SEM, *p ≤ 0.05, n = 10–12.

