
Figure 4.
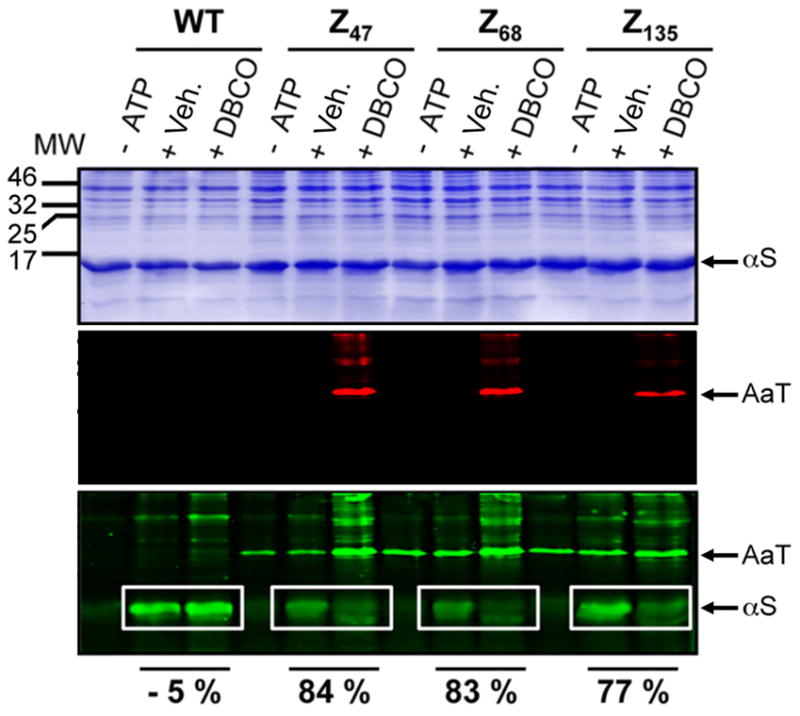
AaT Inhibition in Cells. BL21(DE3) cells expressing AaT WT and mutants were subjected to one of three conditions, + DBCO: AaT-expressing cells were treated with DBCOTMR in DMSO, then lysates of these cells were used to transfer Azf to the αS reporter protein; + Veh.: AaT-expressing cells were treated with DMSO only, then lysates of these cells were used to transfer Azf to the αS reporter protein; − ATP: AaT-expressing cells were treated with DMSO only, then lysates of these cells were used in a mock transfer assay in which ATP was withheld to prevent Azf transfer. In all cases, Azf transfer was detected with a fluorescein alkyne. Transfer yields calculated from the fluorescence intensity of αS bands were used to determine percent inhibition (relative to the corresponding + Veh. lane in the white box). All three images depict the same gel, stained with Coomassie dye (top), imaged using 532 nm excitation (middle), or using 473 nm excitation (bottom). MW: Molecular weight markers (kDa). The protocols for the + DBCO and + Veh. experiments are shown in Figure 3.