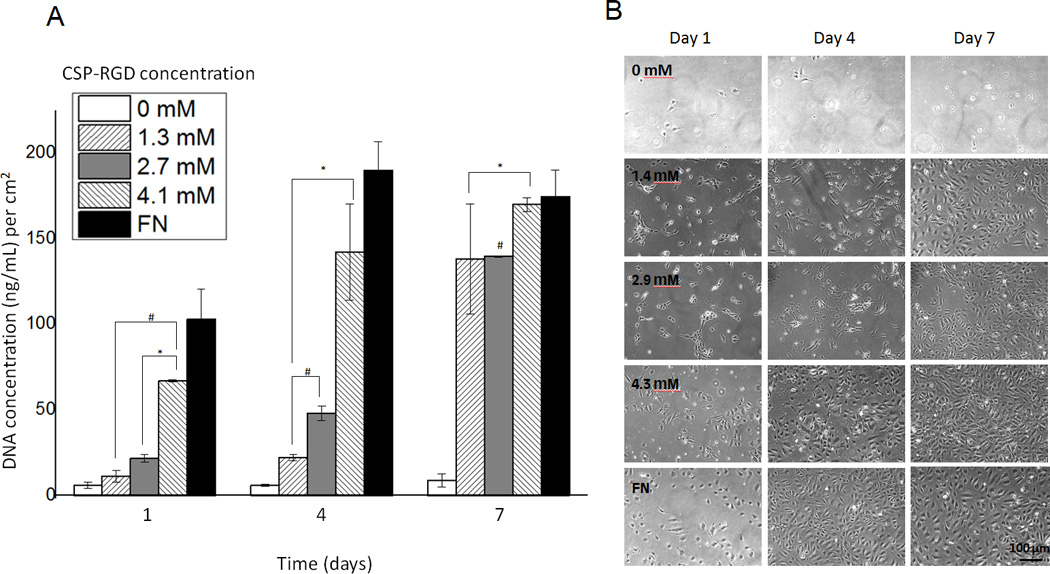
Figure 6.

(A) Cell proliferation four-arm PEG hydrogels (5% w/v) with CSP-RGD concentrations of 0.0 mM, 1.4 mM, 2.9 mM, 4.3 mM and a FN positive control surface. Picogreen assay was used to quantify the DNA concentration at 1, 4, and 7 day timepoints on functionalized hydrogels and fibronectin. (B) 10 × phase contrast images (1.5 × 10⁴ cells/cm2) were taken for respective timepoints (scale bar = 100 µm). *: p<0.05 with regard to DNA content with respect to CSP-PEG negative control at the same time point, #: p<0.05 with regard to DNA content with respect to FN positive control at the same time point.
