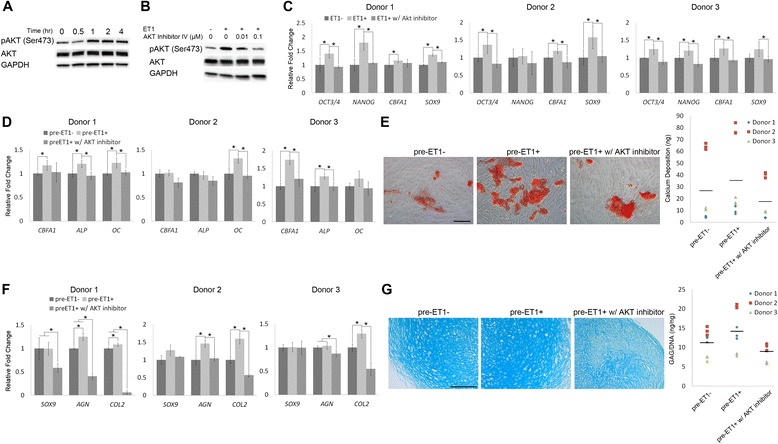
Figure 4.

Response of endothelin-1 (ET1)-treated human mesenchymal stem cells (hMSCs) to regulation of AKT activity. (A) Western blotting analysis of AKT activation in hMSCs after ET1 induction. (B) Western blotting analysis of AKT activity in hMSCs 2 hours after ET1 induction. The cells were treated with or without AKT Inhibitor IV before ET1 induction. (C) Relative mRNA expression levels of potency- and lineage-related markers in ET1-treated hMSCs with or without AKT inhibition for two passages were analyzed by quantitative RT-PCR. (D,E) hMSCs pretreated with or without ET1 or AKT inhibitor for two passages were induced for 21-day osteogenesis. Osteogenesis was evaluated by analyzing relative mRNA expression levels of bone-related markers (D) or Alizarin red staining and quantification of calcium deposition (E). (F,G) hMSCs pretreated with or without ET1 or AKT inhibitor for two passages were made into cell pellets and induced for 21-day chondrogenesis. Chondrogenesis was assessed by analyzing relative mRNA expression levels of cartilage-related markers (F) or Alcian blue staining and quantification of glycosaminoglycan (GAG) production (G). *P < 0.05; n = 3. Scale bar: 200 μm.
