
Figure 1.
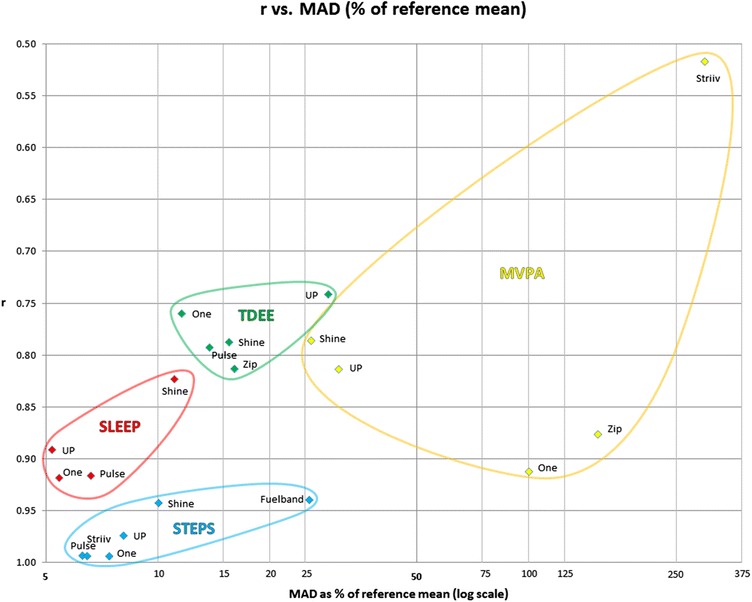
Scatter-plot of Pearson’s r against the median absolute difference (MAD) as a % of the mean of the relevant reference device. Note: r = Pearson correlation; MAD = median absolute difference; TDEE = total daily energy expenditure; MVPA = moderate to vigorous physical activity; UP = Jawbone UP; One = Fitbit One; Zip = Fitbit Zip; Shine = Misfit Shine; Pulse = Withings Pulse; Fuelband = Nike Fuelband; Striiv = Striiv Smart Pedometer.