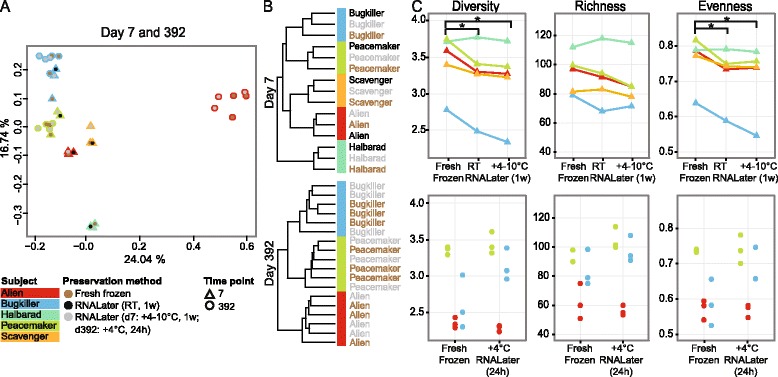
Figure 2.

Comparison of methods for fecal sampling. (A,B) The samples collected in sub-studies 1 (d7) and 2 (d392) clustered by subject (A) and time point (B) but not according to the preservation method (frozen, RNALater (+4 to 10°C or RT for 1 week (1w) on d7; frozen and RNALater +4°C, 24 h on d392) applied (complete linkage clustering based on Euclidean distance). (C) Shannon diversity index, richness and evenness are shown for d7 (upper panels) and d392 (lower panels) and statistically significant differences are indicated by asterisks with P-value ≤0.05 (unpaired Wilcoxon test).
