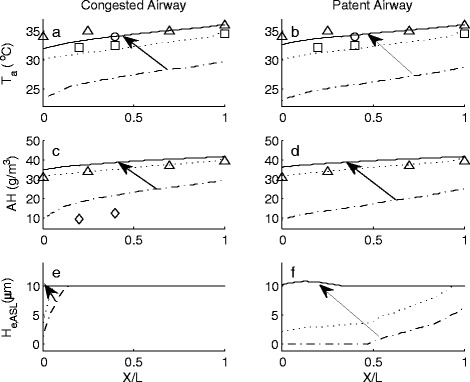
Figure 2.

Inter-airway temperature (Ta), absolute humidity (AH) and ASL water equivalent height (He,ASL) distribution from end of inhalation to maximal change during exhalation. Arrows indicate direction of change. Non-dimensional airway position (X/L), defines the ratio of distance from anterior nasal valve to the posterior choanae within the two airways.  = commencement of exhalation,
  = intermediate value,
  = maximal increase during exhalation. ∆ = Keck et al. [7], ○ = Wiesmiller et al. [57], □ = Lindemann et al. [59].
