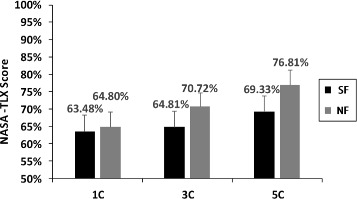
Figure 6.

NASA-TLX mean scores of six experiments (SF/1C, SF/3C, SF/5C, NF/1C, NF/3C, NF/5C). 1C: one channel, 3C: three channels, 5C: five channels. Error bars depict standard deviation.

NASA-TLX mean scores of six experiments (SF/1C, SF/3C, SF/5C, NF/1C, NF/3C, NF/5C). 1C: one channel, 3C: three channels, 5C: five channels. Error bars depict standard deviation.