Figure 1.

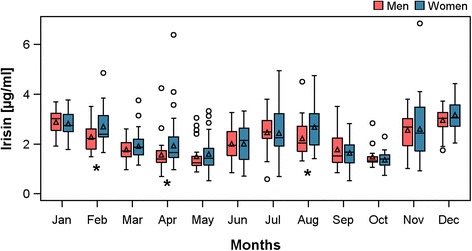
Boxplots of irisin levels separately for men (blue) and women (red) by month. * p < 0.05 for comparison between men and women.

Boxplots of irisin levels separately for men (blue) and women (red) by month. * p < 0.05 for comparison between men and women.