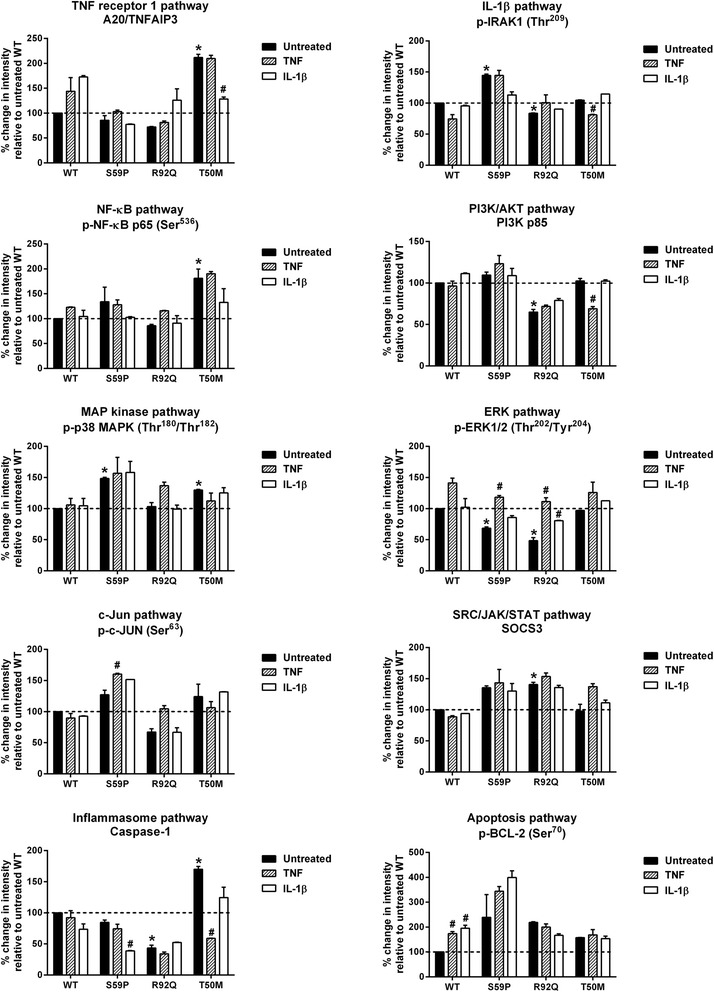
Figure 3.

Reverse phase protein array (RPPA) results. In each panel the percentage changes in fluorescence intensity relative to untreated wild-type (WT) HEK-293 cells are shown. For any signaling pathway, a key component molecule is shown. Bonferroni’s test for pairwise comparisons: *P <0.05 with respect to untreated WT HEK-293 cells; #P <0.05 with respect to its own untreated control.
