
Figure 1.
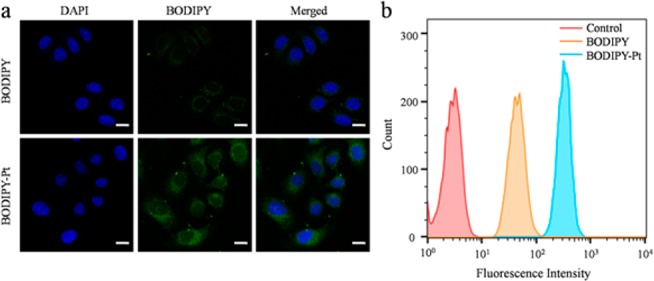
(a) CLSM images of HeLa cells incubated with BODIPY and BODIPY-Pt for 2 h at 37 °C at a concentration of 5 μM. All images show the nuclei (blue), BODIPY (green), and merged images. Scale bars represent 20 μm in all images. (b) Quantitative analysis by flow cytometry upon incubating HeLa cells with BODIPY or BODIPY-Pt (10 μM) at 37 °C for 1 h with cells untreated as a control.