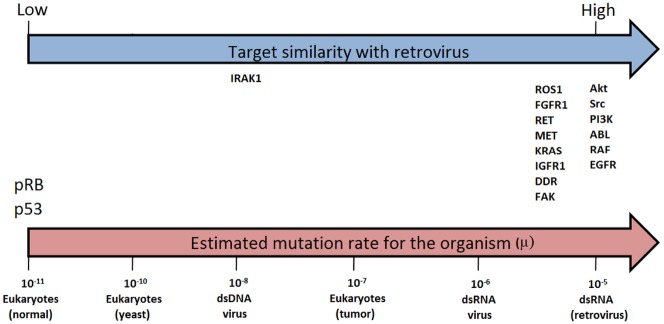
FIGURE 1.

Similarity between retroviral and evaluated target sequences (blue arrow) and estimated mutation rates (μ) for selected organisms (μ = substitutions per nucleotide per cell infection in viruses and per cell division in eukaryotes, i.e., yeast, tumor and normal cells). Estimates from Sanjuán et al. (2010; pink arrow).
