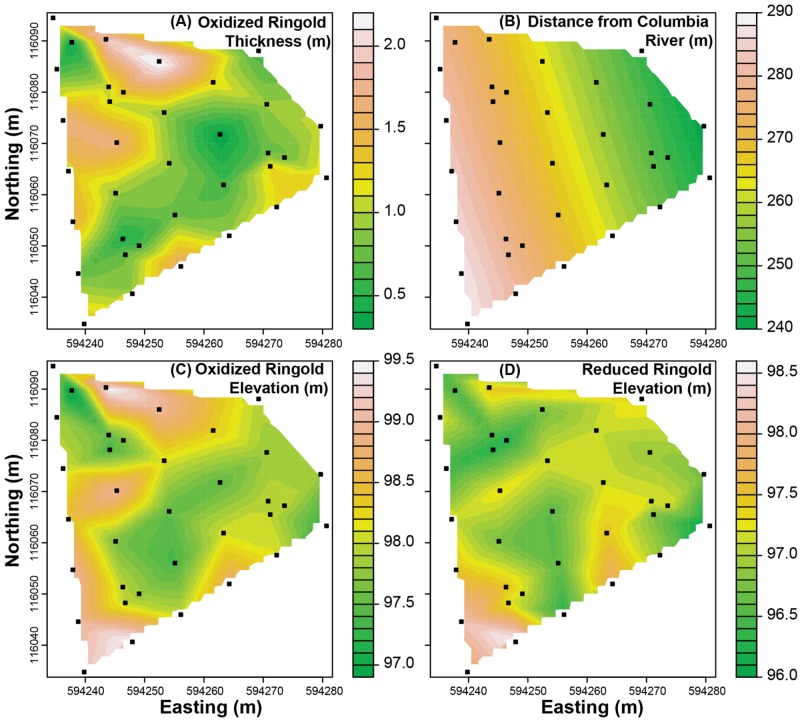
FIGURE 2.
Maps of measured environmental features evaluated as predictors of estimates of ecological-process-influences. (A) The vertical thickness of the oxidized portion of the Ringold formation, (B) the horizontal distance from the Columbia River, (C) the elevation at the top of the oxidized Ringold formation, and (D) the elevation at the top of the reduced portion of the Ringold formation. Solid symbols indicate sampling locations and colors indicate interpolations with magnitudes corresponding to scale bars associated with each panel.

