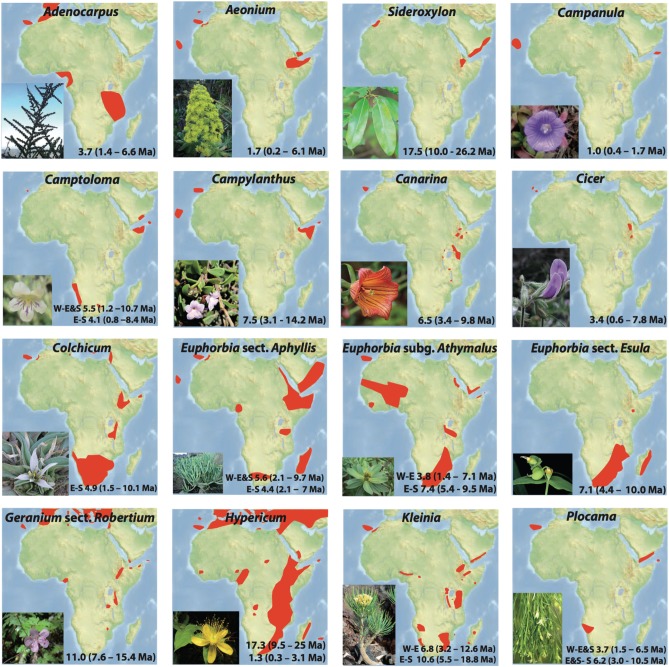
Figure 3.
Individual distributions and habit illustrations for 16 plant lineages exhibiting Rand Flora disjunctions. Estimated divergence times within each lineage correspond to the disjunctions represented in Figures 4, 5 and indicated in the MCC chronograms shown in Figures S1–S16. Taxa names correspond to those in Table 1.

