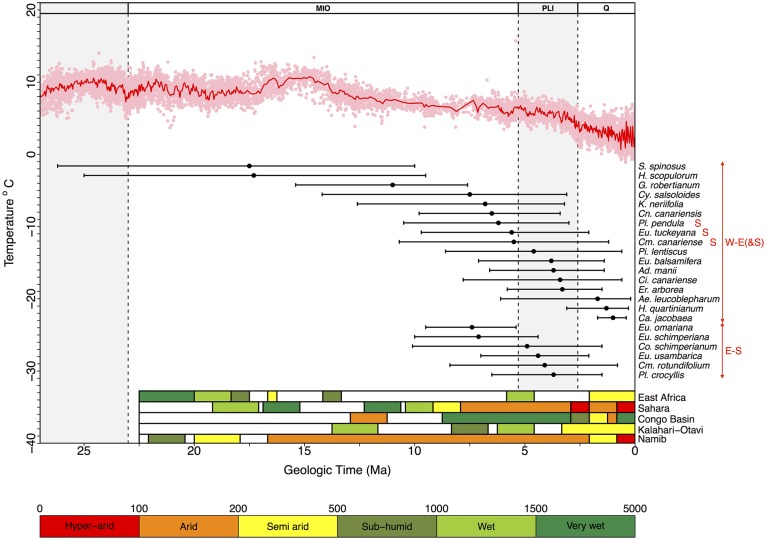
Figure 4.
Diagram showing estimated lineage divergence times (mean and 95% HPD confidence intervals) for Rand Flora disjunctions dated in this study and indicated in the MCC chronograms depicted in Figures S1–S17. W-E(&S): divergence times estimated between disjunct taxa distributed in Macaronesia-NW-W Africa vs. Eastern Africa (a red S indicates presence in Southern Africa); E-S: estimated divergence times between disjunct taxa distributed in southern Arabia-Eastern Africa vs. southern Africa. The red line above represents the change in global temperatures over the Cenozoic as reflected by global-deep-sea oxygen records compiled from Zachos et al. (2008); colored bars in the right bottom corner indicate climatic conditions in five regions that underwent major climate changes—either desertification or tropicalization—during the Neogene (adapted from Senut et al., 2009). Taxa names correspond to those in Table 1, plus two groups from the literature: Pistacia lentiscus and Erica arborea (see Discussion).

