Figure 7.
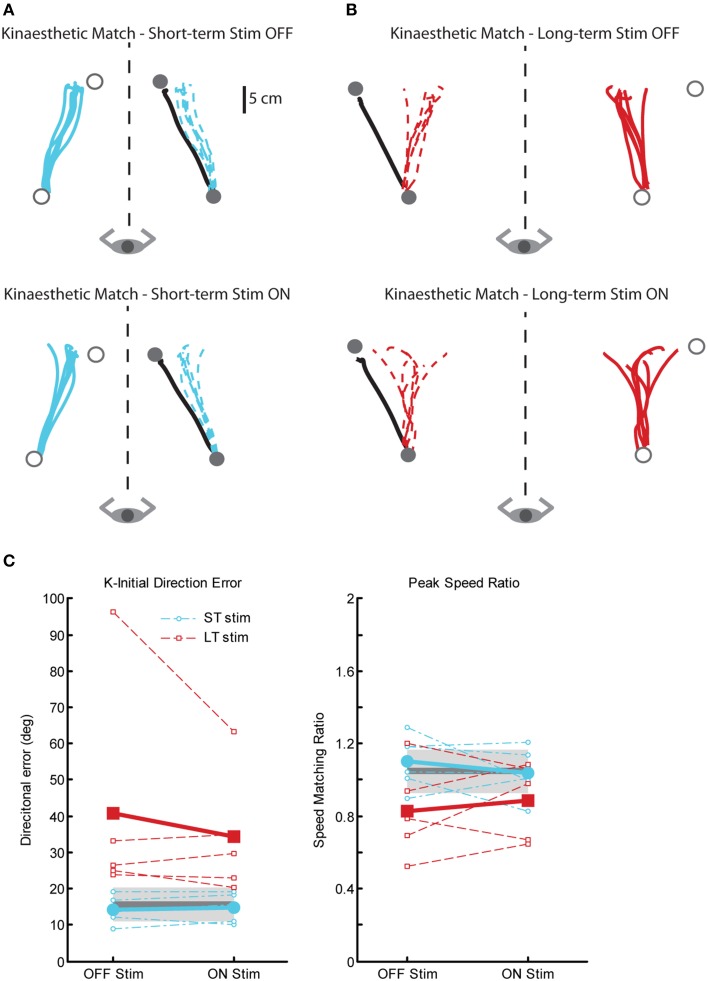
Exemplar data for the kinaesthetic matching task in a ST-stim subject with left Vim DBS (A) and a LT-stim subject with right Vim DBS (B), OFF (top panels) and ON stimulation (bottom panels). (C) Performance on two measures of the kinaesthetic matching task show that all subjects in the LT-stim group (n = 5) make large directional error (K-IDE, left panel), and have difficulty modulating their hand speed to match the speed of the robotic movement, with a tendency to move more slowly (PSR, right panel) compared to controls (n = 11) and ST-stim subjects (n = 6). Average control performance (n = 11) is displayed as a solid dark gray line with a gray box representing subject variability (Standard Deviation). Average patient subject data is displayed as a thicker line, with thinner dotted lines representing individual subjects.

