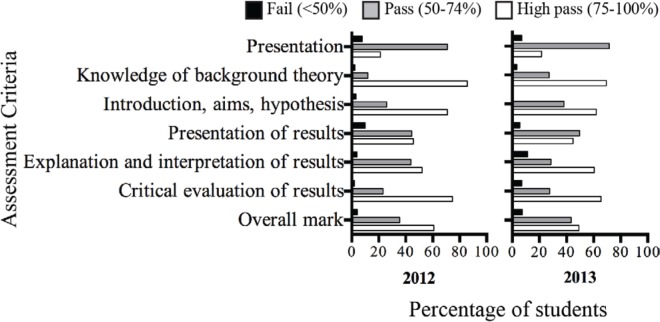
FIGURE 3.
Student performance across project report criteria (as per Table 1) in 2012 and 2013. The proportion of students within the course cohorts who achieved a Fail (<49% – black), Pass (50–74% – grey), or a High Pass (75–100% – white) within each of the criteria is depicted.

