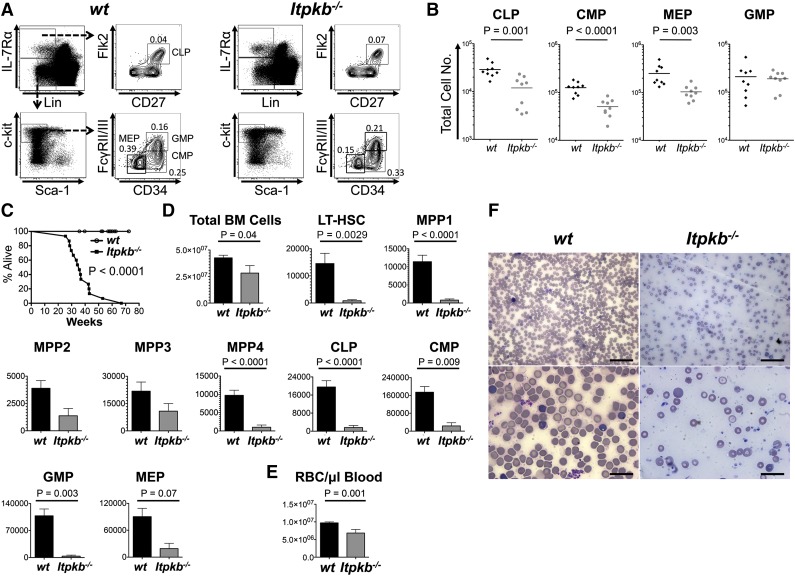
Figure 5.
Itpkb−/− mice die prematurely with hematopoietic failure and lethal anemia. (A-B) BM HPC populations in 6- to 11-week-old WT or Itpkb−/− mice. Shown are representative FACS plots (A) and aggregated total numbers (B) from 3 independent experiments. Bars denote means. Statistical significance of genotype differences was determined by unpaired Student t test (n = 9). (C) Survival of WT (open circles) and Itpkb−/− (closed squares) mice was analyzed by Kaplan-Meier plot. Itpkb−/− mice were found dead or euthanized when moribund. WT littermates euthanized as controls for analysis or after exceeding the maximum lifespan of Itpkb−/− mice were censored. Median survival was 36 weeks. P < .0001 (nKO=14, nWT=23) (D-E) Bar graphs of mean ± standard deviation total numbers of BM cells, the indicated LT-HSC, MPP, or HPC populations (D), or (E) red blood cells/μL peripheral blood in age-matched old WT (n = 14, black bars) and Itpkb−/− (n = 4 for BM cell analysis; n = 3 for red blood cell analysis; gray bars) mice at time of euthanasia. Statistical significance of genotype differences was determined by unpaired Student t test. Representative raw data in supplemental Figure 5. (F) Blood smears from WT or Itpkb−/− mice were Wright stained and analyzed on a Nikon Eclipse E400 microscope equipped with ×10 (100 magnification, 0.25 numerical aperture), ×20 (200 magnification, 0.40 numerical aperture), ×50 oil (500 magnification, 0.90 numerical aperture), and ×100 oil (1000 magnification, 1.25 numerical aperture) lenses. Images were acquired on a DS-Fi1 Nikon Digital Sight system, cropped, resized, and tonal range and color balance adjusted using the “auto level” function in Photoshop CS6. All procedures were carried out at room temperature. Scale bars: 50 μm (top), 20 μm (bottom).

