Figure 6.
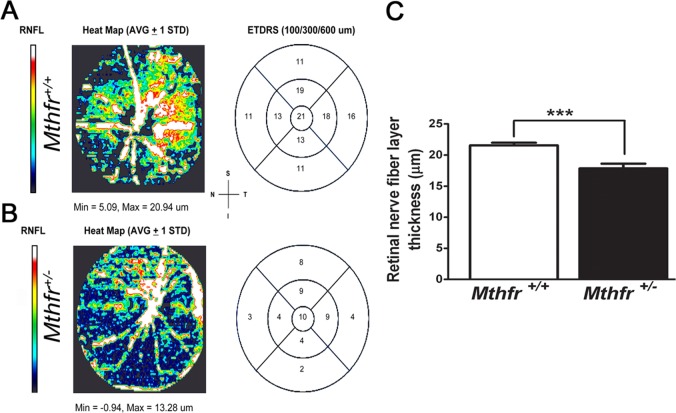
Automated segmentation analysis of retinal nerve fiber layer thickness (RNFL) in retinas of Mthfr+/− mice at 24 weeks. To evaluate thickness of RNFL in retinas of Mthfr+/− mice compared to Mthfr+/+ mice, automated segmentation analysis of RNFL was performed using SD-OCT. Representative SD-OCT heat maps of RNFL in 24-week-old (A) Mthfr+/+ and (B) Mthfr+/− mice are provided. Heat maps are color coded, such that white color reflects thicker RNFL, while dark blue represents thinner RNFL. The EDTRS in Mthfr+/− demonstrated even distribution of thinner RNFL in 300 and 600 μM zones in all quadrants. (C) For validation of automated segmentation analysis, we performed manual OCT measurements with 5 × 5 grid retinal template. Graphical depiction of the RNFL (mean ± SEM) is shown. *Significantly different from Mthfr+/+ mice; P < 0.01. ETDRS, Early Treatment of Diabetic Retinopathy Study; S, superior; I, inferior; N, nasal; T, temporal.

