Figure 7.
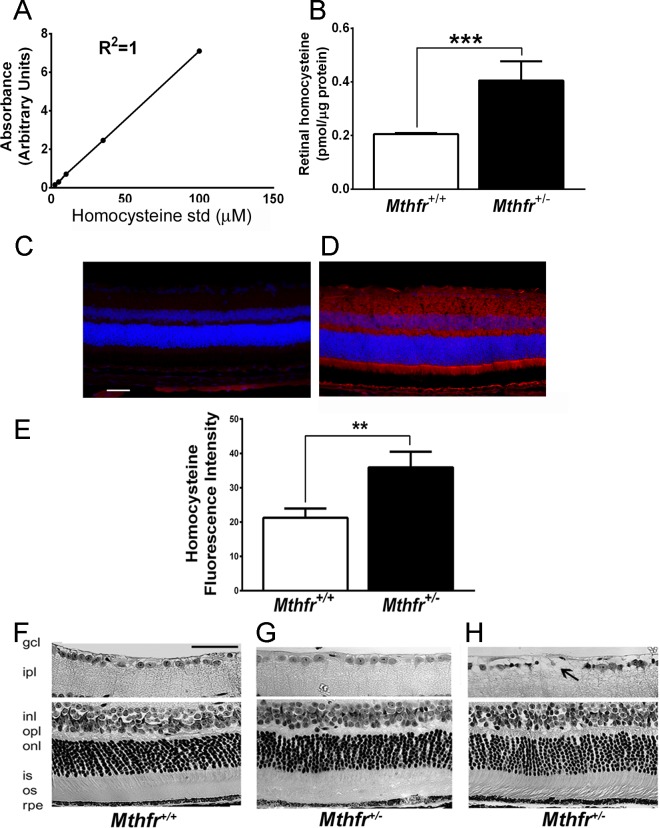
Analysis of retinal hcy levels and morphology in Mthfr+/+ and Mthfr+/− mice. Retinal hcy levels were quantified by HPLC and IHC analysis. (A) TheHcy standard curve used for calculation of retinal hcy levels. (B) Graphical representation of retinal hcy levels in Mthfr+/+ and Mthfr+/− mice (24 weeks) expressed as pmol/μg protein. ***Significantly different from wildtype mice, P < 0.001. (C, D) Retinal cryosections from Mthfr+/+ and Mthfr+/− mice (24 weeks) were subjected to immunodetection of hcy; Alexa Fluor 555-conjugated antibody (red) was used to detect positive signals. (E) The immunopositive signals were quantified using Metamorph software. **Significantly different from wild type mice, P < 0.01. (F) Representative hematoxylin and eosin–stained sections of retinas harvested from Mthfr+/+ and (G, H) Mthfr+/− mice (24 weeks). Areas of cellular dropout observed in retinas from Mthfr+/− mice are noted by the black arrow (H). Calibration bar: 50 μM. ipl, IPL; opl, OPL; is, IS; os, outer segment.

