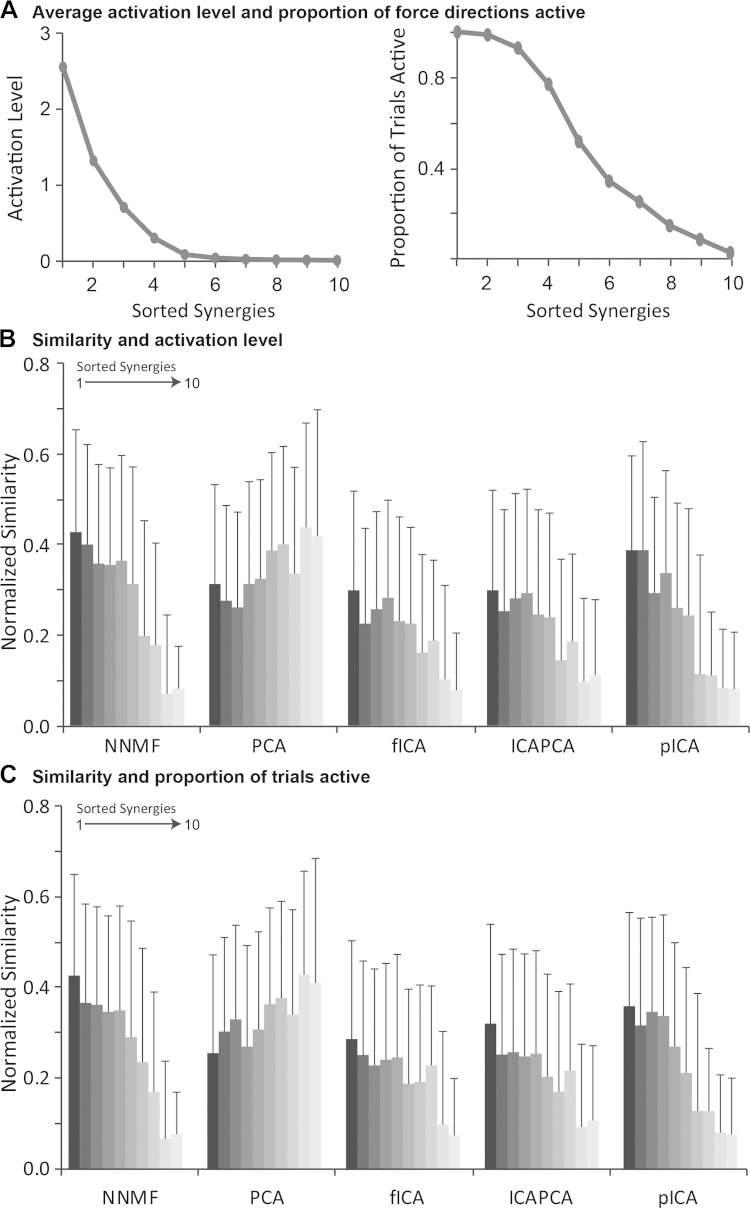
Fig. 5.
A: synergies were sorted by activation level (from the C matrix) and proportion of force directions active. Normalized similarity was greatest for synergies that were more active (B) or that were active for a greater proportion of force directions (C) for NNMF, fICA, PCAICA, and pICA. Error bars indicate means ± SD.

