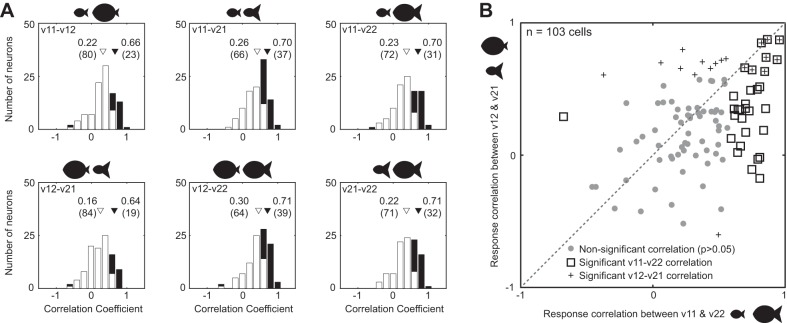
Fig. 3.
Consistency in shape selectivity across versions. A: distribution of correlation coefficients between the responses to the 12 shapes for every possible pair of versions. White bars represent statistically insignificant correlations, and black bars represent significant correlations (P < 0.05). B: response correlation between versions v11 and v22 plotted against response correlation between versions v12 and v21, across all 103 neurons.

