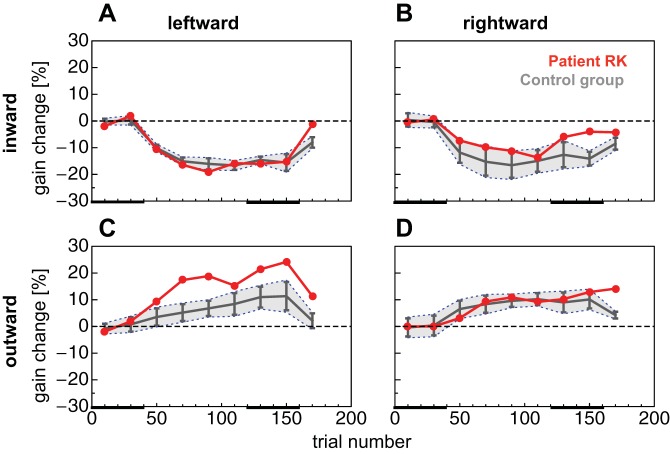
Fig. 3.
A: adaptation curve for leftward reactive saccade inward adaptation sessions. Saccade landing positions from the control group are shown in gray, and those from patient RK are shown in red. Data are binned with a bin width of 20 trials. Error bars represent 95% confidence intervals and gray shaded areas SDs. Black bars at bottom represent test trial epochs in preadapted and adapted states, respectively. B–D: adaptation curves for rightward reactive saccade inward adaptation (B), contraversive (leftward) reactive saccade outward adaptation (C), and ipsiversive (rightward) reactive saccade outward adaptation (D). Same conventions as in A.

