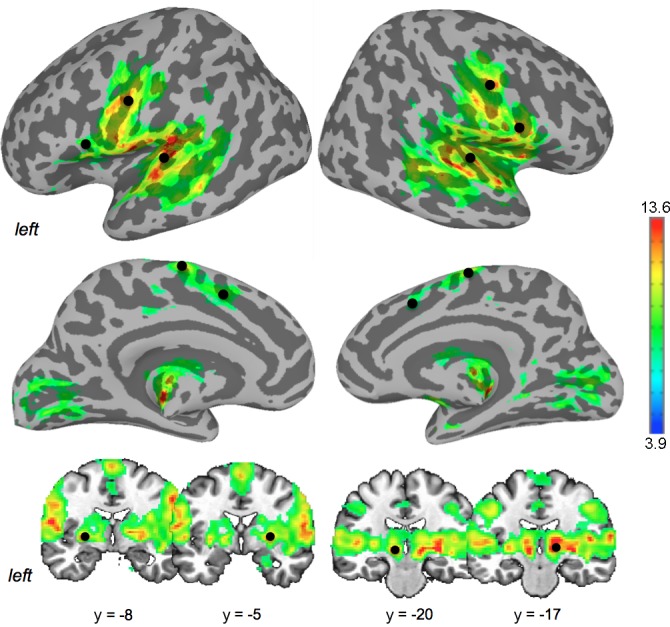
Fig. 1.

Brain activation during speech production and the seed regions. A group statistical parametric map of brain activation during speech production is shown on inflated cortical surfaces and series of coronal slices in the AFNI standard Talairach-Tournoux space. Black spheres indicate the location of 14 seed regions of interest. The corresponding location coordinates are given in Table 1. Color bar indicates t-values.
