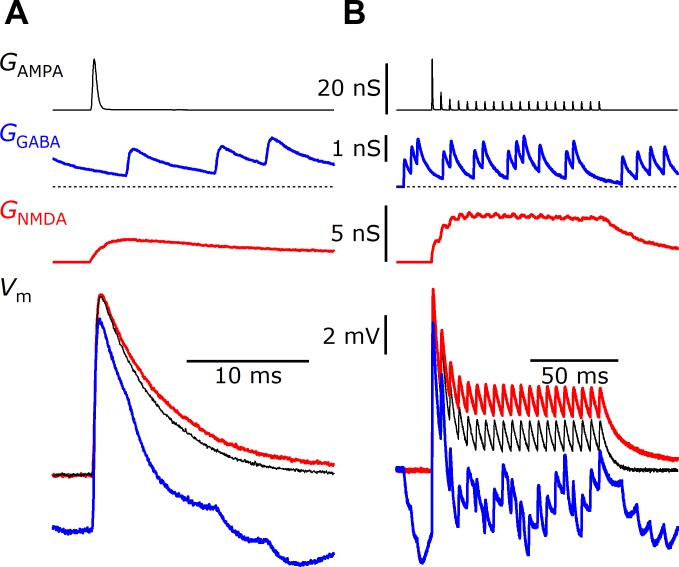
Fig. 4.
Linear and nonlinear synaptic conductances implemented by dynamic clamp. A 20-nS AMPA (black traces), a 1-nS GABA (blue traces), and a 2-nS NMDA (red traces) conductance were based on synaptic conductances recorded in voltage-clamp experiments and delivered to the model cell using 2-electrode dynamic clamp. The dynamic clamp also specified a leak conductance as in Fig. 3. The cellular responses to AMPA alone (black), AMPA plus GABA (blue), or AMPA plus NMDA (red) are shown in the bottom traces in response to single stimuli (A) or a 200-Hz train of stimuli (B).

