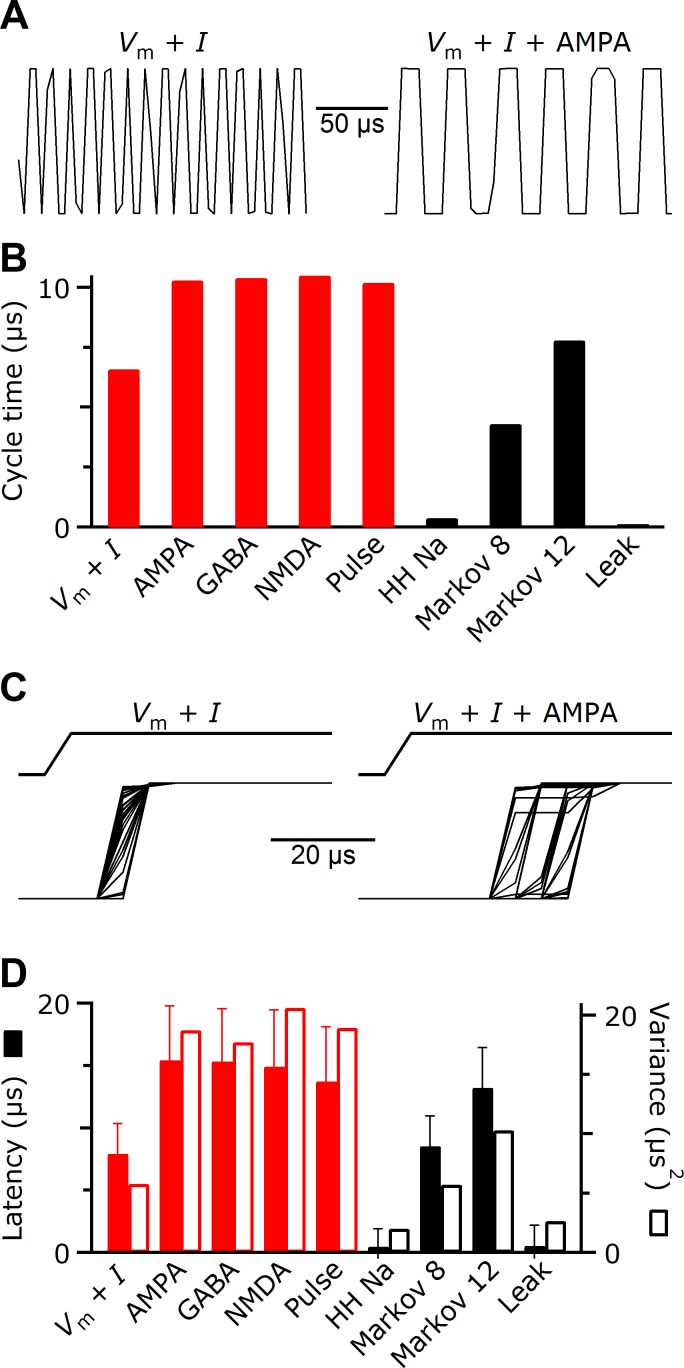
Fig. 7.
Using the test functions to measure speed, latency, and jitter of the dynamic clamp. For these measurements, the dynamic clamp was run on a Dell OptiPlex 745 running Windows XP with a National Instruments Peripheral Component Interconnect Express (PCIe) 6361 data acquisition system. Test results are expected to be highly system-specific. A: output of the dynamic clamp in cycle time test mode. The output oscillates between 2 arbitrary values on each cycle of the dynamic clamp, so peak width indicates the duration of each cycle. The cycle time is extremely fast with no conductances specified and only reading membrane potential (left trace) and is slowed somewhat when an AMPA conductance is added (right trace). B: the effect on cycle time of different dynamic-clamp components. Red bars indicate components that require interaction with the A/D system, and black bars indicate purely computational components. As more components are required by the user, these components add to each other for the overall cycle duration. The greatest cost to cycle time comes from reading additional A/D channels. C: example output of the dynamic clamp in echo test mode. A voltage pulse (top traces) is sent to the dynamic clamp, which echoes the voltage out of the D/A (bottom traces, 50 trials overlaid). The latency and variability of the echo are minimal with no conductance implemented (left traces). Latency and variability of the dynamic clamp increase with an AMPA component in the dynamic clamp (right traces). D: the effect on latency (solid bars), jitter (standard deviation of latency, error bars), and variance (open bars) of different dynamic-clamp components. As more components are required, the latencies and variances of multiple components sum.

