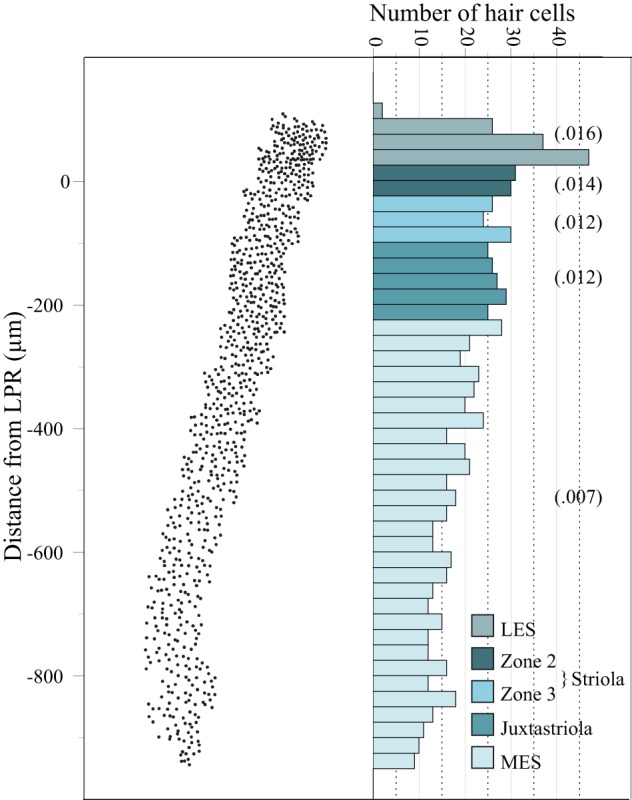
Fig. 11.

Regional differences in hair cell density. Left: x-y plot showing the coordinates of all hair cells in a 100-μm-wide mediolateral transect through the macula (black line with tick marks in Fig. 1B). The macula was treated with phalloidin to label hair cell bundles and cuticular plates, which allowed us to distinguish the line of hair cell polarity reversal (LPR). y-Axis, distance from the LPR, where 0 = LPR (x-axis shows approximate anterior-posterior spread of hair cells in the transect). In macular regions supplied by bouton afferents (LES, Zone 2, juxtastriola, MES) hair cell density decreases from lateral (top) to medial (bottom); there is also a slight density decrease in striolar Zone 3 (the calyx band). Right: histogram showing lateral-to-medial decrease in hair cell density. The histogram is aligned as closely as possible with the x-y plot (left) on which it is based. Each bar represents ∼25 μm along the mediolateral axis. Approximate boundaries of each macular subdivision are indicated by different colors (see key). Numbers in parentheses represent the average number of hair cells per zone in each region of the macula. Note that these density numbers are lower than those in Table 7 because macular area in this histogram is not corrected for shrinkage as it is in Table 7 (see legend of Table 7).
