
Fig. 2.
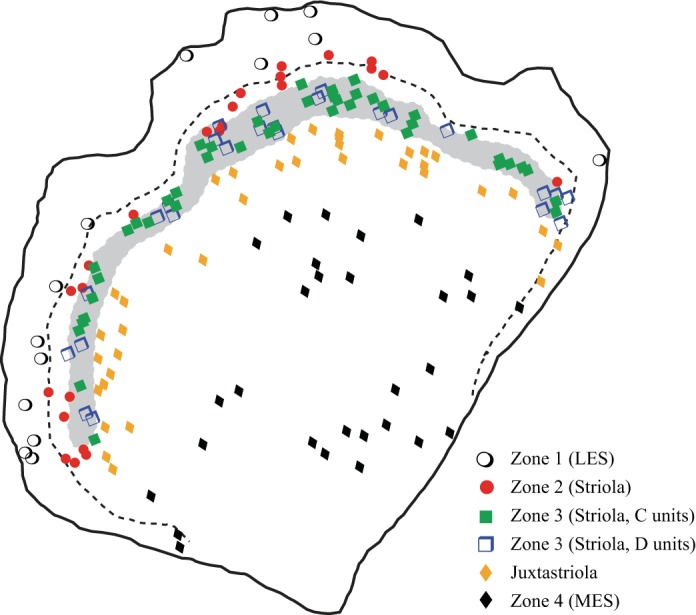
Macular location of reconstructed afferent terminals. Schematic of right turtle utricular macula. Gray profile represents the calyx band (Zone 3); C and D units are restricted to this band. Dashed line represents the line of hair cell polarity reversal (LPR). The location of the calyx band and the trajectory of the LPR are based on a map of an in situ utricle labeled with phalloidin and α-tubulin to show hair cell orientation (they label stereocilia and kinocilia, respectively) and with β-tubulin to show calyces (Graydon et al. 2006). Symbols represent approximate location of all afferent terminals reconstructed in this study. Terminal classes are indicated by different symbols (see key).