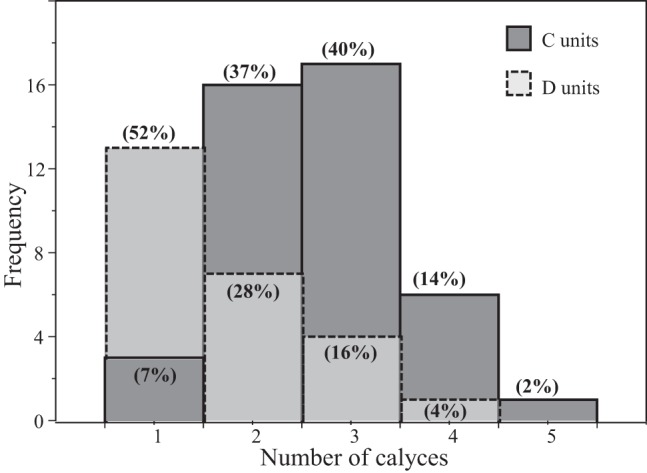
Fig. 5.

Calyx complexity in C and D units. Histogram compares calyx complexity in reconstructed C (solid lines) and D (dashed lines) units. x-Axis, number of calyces in the terminal; y-axis, number of afferents. Numbers in parentheses for each bar indicate % of C or D units bearing the specified number of calyces in a terminal. For example, 52% of D units and 7% of C units are simple (1 calyx); 40% of C units and 16% of D units end in triple calyces.
