Fig. 5.

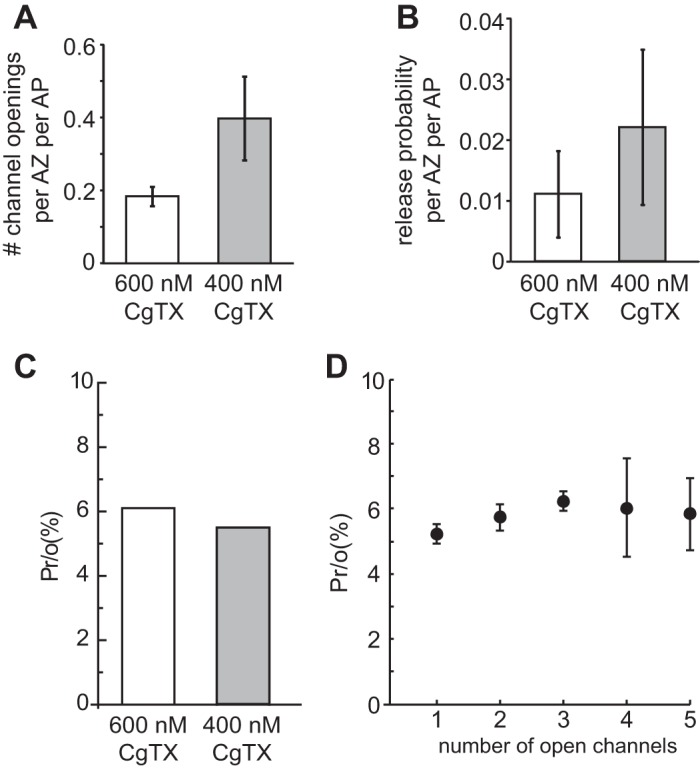
The coupling of Ca2+ influx to vesicle fusion events after exposure to a high concentration of CgTX. A: shown is the number of detected Ca2+ channel openings per active zone and action potential after exposure to either 400 nM or 600 nM CgTX. These data are obtained by dividing the number of imaged Ca2+ entry sites per action potential by the number of active zones within an imaged area (see Fig. 3). B: normalized release probability per active zone and action potential after exposure to 400 nM or 600 nM CgTX determined by dividing the average QC by the average number of active zones in the nerve terminal of adult frog cutaneous pectoris NMJs (700). C: experimental estimate of release probability per Ca2+ channel opening [Pr/o(%)] is similar (5–6%) when calculated following exposure to 400 nM or 600 nM CgTX (plot generated using the data in A and B). D: MCell simulations predict that release probability following a single Ca2+ channel opening is small (5–6%) and comparable to our experimental estimate shown in C. Further, the release probability per Ca2+ channel opening remains relatively constant even as the number of open channels within an active zone is increased in our simulation.
