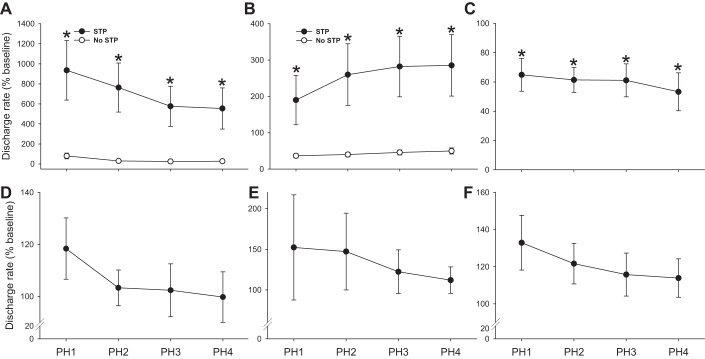
Fig. 11.
Neuronal discharge during the posthypoxic period. For presentation of the posthypoxia data, the same general classifications used in prior figures are maintained. Thus data are presented from non-respiratory-modulated interneurons that increased bursting during hypoxia (A), decreased bursting during hypoxia (B), or did not change bursting during hypoxia (C). The mean posthypoxic response is also shown for cells classified as prephrenic (D), and both rhythmic (E) and tonic phrenic motoneurons (F). For neurons with the largest sample size (i.e., hypoxia-excited and hypoxia-inhibited), a bimodal distribution in the posthypoxia discharge patterns was noted with some cells continuing to burst at values above baseline (i.e., STP of burst discharge) and others immediately returning to baseline discharge rates. Therefore, in A and B the data are grouped into cells that did (●) or did not (○) show STP following hypoxia. PH1–PH4 indicates posthypoxia minutes 1–4. *P < 0.05 vs. baseline.

