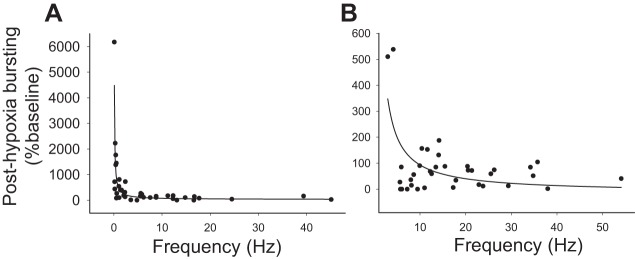
Fig. 12.
Relationship between baseline burst frequency and STP following hypoxia. The results of nonlinear regression analyses of the baseline discharge frequency (Hz) and posthypoxic bursting (%baseline) are presented for hypoxia-excited (A) and hypoxia-inhibited interneurons (B). For both groups, a statistically significant relationship was present (P < 0.001) indicating that cells with a low discharge rate at baseline were more likely to show persistent increases in discharge rate following the hypoxic stimulus.

