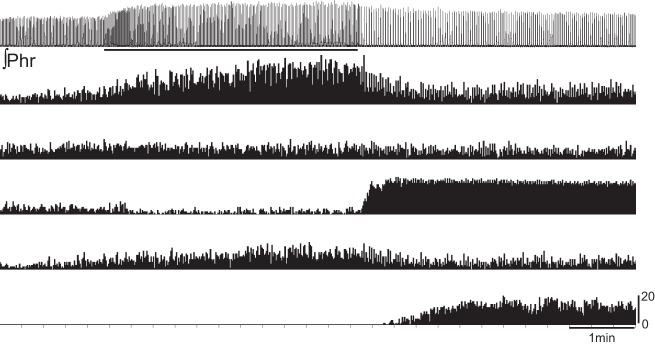
Fig. 7.

A representative example illustrating the diversity of neuronal responses to hypoxic exposure. The phrenic nerve signal (∫Phr) is presented at the top of the trace, with the horizontal bar indicating the period of hypoxic exposure. Below the phrenic nerve signal are plots of instantaneous burst frequency for five different neurons recorded simultaneously using the multielectrode array. This example illustrates that some cells responded robustly during the period of hypoxia, while others responded with a robust increase in bursting following the hypoxic exposure.
