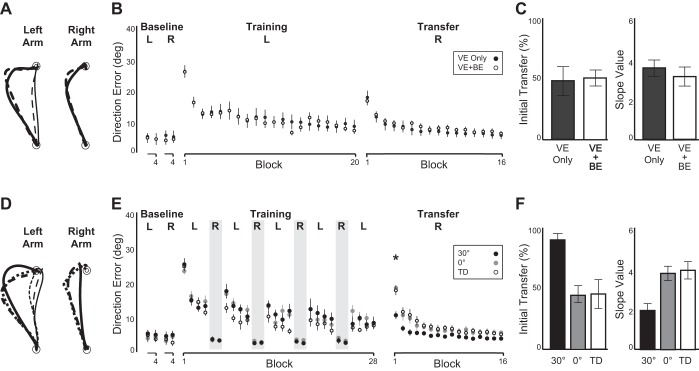
Fig. 2.
A–C, experiment 1. A: hand-paths from representative subjects observed on 1st (thick lines) and last (thin lines) trials with left arm during initial training session (left panel), and those observed on 1st trial with right arm during subsequent transfer session (right panel). Solid lines represent the group who received continuous visual feedback only [vector error (VE) only], broken lines the group who received continuous visual feedback for first 50 trials and binary error (VE) feedback for last 50 trials (VE + BE). B: mean performance measure. Every data point shown on x-axis represents the average of 5 consecutive trials (block) across all subjects within each group (means ± SE). C: percentages of initial transfer from left to right arm (left panel), and slope values during right-arm transfer session (right panel). Slope values obtained from nonlinear logarithmic regression equations were used to calculate the adaptation rate. D–F, experiment 2. D: hand-paths from representative subjects observed on first (thick lines) and last (thin lines) trials with left arm during initial training session (left panel), and those observed on first trial with right arm during subsequent transfer session (right panel). Solid lines represent the group who reached toward 30-degree target with right arm (30°), broken lines the group who reached toward 0-degree target with right arm (0°), dotted lines the group who did not move right arm during left-arm training session (Time Delay). E: mean performance measure, same as B (* < 0.05). F: percentages of initial transfer (left panel) and slope values (right panel), same as C. TD, time delay.

